
DS: It’s nice to have more money in your pocket. And thanks to the 2017 tax cuts, the typical American is now paying less in taxes.
But that’s not to say we’re not still sending a hefty sum of money to Washington. Tally up all the payroll and other taxes on earnings and income, and you’ll find that the average American household forks over more than $26,000 to the feds each year. Last year, Washington collected more than $3.3 trillion in taxes. So where exactly does all that money go?
Some believe most of it goes to foreign aid and defense. Others think corporate subsidies dominate the budget.
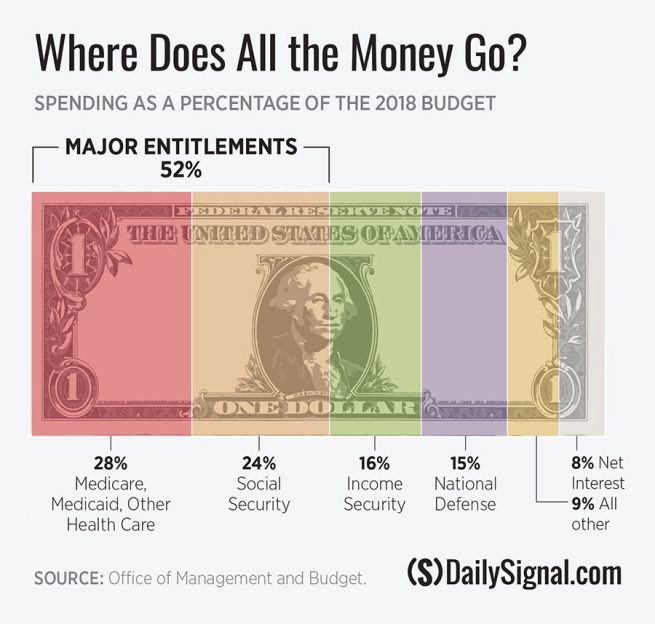
In reality, health entitlements—Medicare, Medicaid, Obamacare—and Social Security are the largest and fastest growing programs. Unless Congress fixes these four programs, they—and the ever-growing interest payments on the national debt—will consume every dollar of taxes paid by 2041. That leaves no money for anything else. Uncle Sam couldn’t spend a penny on defense, food assistance, highways, or education without driving the country further into debt.
Right now, Medicare, Medicaid, and Obamacare subsidies account for more than a quarter (28.8%) of all federal spending. Ten years from now, they’re projected to gobble up more than a third of the budget.
Meanwhile, Social Security, the single largest federal program, accounts for roughly a quarter of all federal spending all by itself. Its trust funds already pay out more than they take in, and its finances will only deteriorate faster as more and more boomers retire.
The Social Security trustees project that unless Congress implements much-needed reforms, the program will run out of reserve funds by 2034, potentially triggering a 23% cut in benefits.
Other income security programs—veterans’ benefits, food and housing assistance, federal employee retirement, and disability—account for 16% of the budget. That’s more than we spend on national defense. And the defense budget covers everything from military paychecks to operations overseas to the research, development, and acquisition of new technologies and equipment.
At 15% of the federal budget, defense spending is the last major category of federal spending. Most of what is left goes to people and corporations who hold Washington’s IOUs. Currently, 8% of the budget goes to interest payments on this debt.
Over the coming decade, U.S. debt held by the public is projected to balloon to nearly 93% of gross domestic product. But don’t blame that on “inadequate taxation.” By 2024, the pro-growth tax enacted in 2017 will actually raise more revenue yearly than the old system.
No, the culprit here is runaway spending, driven primarily by huge increases in health and Social Security outlays. And the long-term consequences of deficit spending are dire. keep reading
Cloward-Piven theory materialized.
Keep in mind this Obama advisor Piven is still alive and and kicking and no doubt happy with this!
WTF is “Income Security?”
“veterans’ benefits, food and housing assistance, federal employee retirement, and disability”
How much of each contributes to the 16%?
“Food and Housing Assistance” is, exactly what, for example?
We know that “Veterans’ benefits” don’t, actually, benefit Veterans, but, instead, benefit a wide circle of incompetence and ineptitude (with an appropriate skim).
And vast welfare programs are disguised as “Farm Subsidies” and “SNAP” and the like – so the reality is (probably) much different than this.
There exist entire Agencies who contribute NOTHING to mankind but distribute $Billions to well-connected sycophants and lickspittles – eg EPA, HHS, Education, Energy, Agriculture, HUD, and Labor.
izlamo delenda est …
Would be interesting to see the same charts from previous years so we can compare growth or reduction in the various categories.
Whatever Occasional-Cortex’s salary is (and most everyone else in DC…) – THAT’S good many after BAD! 😡